
Study Guide
Field 244: Multi-Subject: Secondary Teachers
(Grade 7–Grade 12)
Part Two: Mathematics
Recommendation for individuals using a screenreader: please set your punctuation settings to "most."
Sample Selected-Response Questions
The following reference material will be available to you during the test:
Competency 0001
Number and Quantity
1. Light travels at a speed of approximately 1.08 times 10 to the ninth power kilometers per hour. If the Orion Nebula is approximately 1.3 times 10 to the sixteenth power kilometers from Earth, approximately how long does it take light to travel from this nebula to Earth?
- 8.3 times 10 to the sixth power hours
- 1.2 times 10 to the seventh power hours
- 8.3 times 10 to the twenty fourth power hours
- 1.2 times 10 to the twenty fifth power hours
- Enter to expand or collapse answer. Answer expanded
- Correct Response: B. It takes light 1 hour to travel 1.08 times 10 to the ninth power kilometers , which is the ratio 1 hour over 1.08 times 10 to the power of 9 k m. Multiply this ratio by the distance between Earth and the Orion Nebula to obtain 1 hour over 1.08 times 10 to the power of 9 k m times left paren 1.3 times 10 to the sixteenth power k m right paren equals 1.3 times 10 to the seventh power over 1.08 hours is approximately equal to 1.2 times 10 to the seventh power hours.
2. start bold Use the problem below to answer the question that follows. end bold
During a special event, visitors at an art museum are given modeling clay and encouraged to make scale models of the sculptures on display. A visitor estimates that the height and length of a sculpture are 4.5 feet and 6 feet, respectively. If the visitor wants the scale model to be 4 inches long, how tall should the scale model be?
Which equation can be used to find the height of the scale model?
- height of sculpture over height of model equals length of model over length of sculpture
- (height of sculpture)(length of sculpture) = (height of model)(length of model)
- height of sculpture over length of sculpture equals height of model over length of model
- (height of sculpture)(height of model) = (length of sculpture)(length of model)
- Enter to expand or collapse answer. Answer expanded
- Correct Response: C. The dimensions of the sculpture can be written as a ratio in the form height of sculpture over length of sculpture. Keeping the measure for height in the numerator and the measure for length in the denominator, the dimensions of the scale model can be written as a ratio in the same form; that is, heigth of model over length of model. Because the scale model will be proportional to the sculpture, the two ratios are equal; that is, height of sculpture over length of sculpture equals height of model over length of model.
3. A certain fruit is 80 percent water by weight, and when dried, it is 15 percent water by weight. If 100 pounds of this fruit are dried, which weight is closest to the weight of the dried fruit?
- 24 pounds
- 32 pounds
- 75 pounds
- 85 pounds
- Enter to expand or collapse answer. Answer expanded
- Correct Response: A. Since these fruit are 80 percent water by weight, then 20 percent of the weight is not water, so 100 pounds of the fruit contain 20 pounds of non-water matter. These 20 pounds must make up the non-water matter in the dried fruit. Since the dried fruit are 15 percent water by weight, the non-water matter is 85 percent of the weight, so 20 equals 0.85 times total weight; that is, the total weight of the dried fruit is 20 divided by 0.85 or about 24 pounds.
Competency 0002
Algebra and Functions
4. start bold Use the graph below to answer the question that follows. end bold
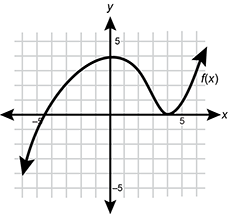
A coordinate plane is shown. The x axis is labeled 5 at 5 units to the right of the origin and is labeled negative 5 at 5 units to the left of the origin. The y axis is labeled 5 at 5 units up from the origin and is labeled negative 5 at 5 units down from the origin. From left to right, a curve f of x is in quadrant 3 and passes through the points negative 6 comma negative 4 and negative 5 comma negative 1. The curve continues into quadrant 2 and passes through the points negative 4 comma 1, negative 3 comma 2, and negative 2 comma 4. The curve continues into quadrant 1 and passes through the points 0 comma 5, 2 comma 4, 3 comma 1, 4 comma 0, 5 comma 1, and 6 comma 3.
If the graph shown represents f of x, what is the value of the quantity f of 2 plus f of 4 all over f of negative 2?
- negative
- negative
- 0
- 1
- Enter to expand or collapse answer. Answer expanded
- Correct Response: D. The value of the function f of x at x is the value of the y-coordinate as the graph passes through x. When the graph shown passes through the point (2, 3), so when x is 2, the value of y is 3, and therefore, f of 2 equals 3. Similarly, f of 4 equals 0 and f of negative 2 equals 3. Substituting these values into the expression the quantity f of 2 plus f of 4 all over f of negative 2 yields the quantity 3 + 0 all over 3, which equals 1.
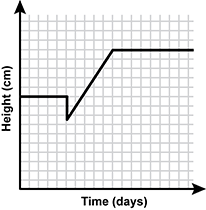
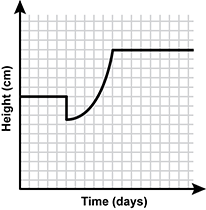
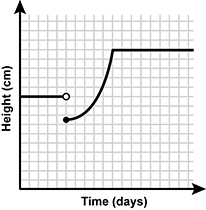
5. A student is studying the growth of a certain type of plant for a science project. The student notices that when these plants are mature, they maintain the same height. When these plants are trimmed, they will grow at a constant rate for several days before reaching their new height. Which graph best models the growth of a mature plant that was trimmed?
-
 Quadrant 1 of a coordinate plane 1 is shown. The x axis is labeled Time days. The
y axis is labeled Height centimeters. A line segment extends from the point 0 comma
10 to the point 5 comma 10. From there, a line segment extends to the point 5 comma
7.5. From there a line segment extends to the point 10 comma 15. From there, a line
segment extends to the point 18 comma 15.
Quadrant 1 of a coordinate plane 1 is shown. The x axis is labeled Time days. The
y axis is labeled Height centimeters. A line segment extends from the point 0 comma
10 to the point 5 comma 10. From there, a line segment extends to the point 5 comma
7.5. From there a line segment extends to the point 10 comma 15. From there, a line
segment extends to the point 18 comma 15. -
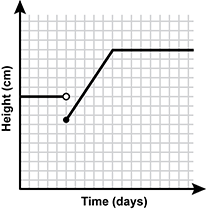 Quadrant 1 of a coordinate plane 1 is shown. The x axis is labeled Time days. The
y axis is labeled Height centimeters. A line segment extends from the point 0 comma
10 to the point 5 comma 10. The point 5 comma 10 is an open circle. The point 5
comma 7.5 is a closed circle. A line segment extends from the point 5 comma 7.5
to the point 10 comma 15. From there, a line segment extends to the point 18 comma
15.
Quadrant 1 of a coordinate plane 1 is shown. The x axis is labeled Time days. The
y axis is labeled Height centimeters. A line segment extends from the point 0 comma
10 to the point 5 comma 10. The point 5 comma 10 is an open circle. The point 5
comma 7.5 is a closed circle. A line segment extends from the point 5 comma 7.5
to the point 10 comma 15. From there, a line segment extends to the point 18 comma
15. -
 Quadrant 1 of a coordinate plane 1 is shown. The x axis is labeled Time days. The
y axis is labeled Height centimeters. A line segment extends from the point 0 comma
10 to the point 5 comma 10. From there, a line segment extends to the point 5 comma
7.5. From there an upward opening parabolic curve extends to the point 10 comma
15. From there, a line segment extends to the point 18 comma 15.
Quadrant 1 of a coordinate plane 1 is shown. The x axis is labeled Time days. The
y axis is labeled Height centimeters. A line segment extends from the point 0 comma
10 to the point 5 comma 10. From there, a line segment extends to the point 5 comma
7.5. From there an upward opening parabolic curve extends to the point 10 comma
15. From there, a line segment extends to the point 18 comma 15.
-
 Quadrant 1 of a coordinate plane 1 is shown. The x axis is labeled Time days. The
y axis is labeled Height centimeters. A line segment extends from the point 0 comma
10 to the point 5 comma 10. The point 5 comma 10 is an open circle. The point 5
comma 7.5 is a closed circle. An upward opening parabolic curve extends from the
point 5 comma 7.5 to the point 10 comma 15. From there, a line segment extends to
the point 18 comma 15.
Quadrant 1 of a coordinate plane 1 is shown. The x axis is labeled Time days. The
y axis is labeled Height centimeters. A line segment extends from the point 0 comma
10 to the point 5 comma 10. The point 5 comma 10 is an open circle. The point 5
comma 7.5 is a closed circle. An upward opening parabolic curve extends from the
point 5 comma 7.5 to the point 10 comma 15. From there, a line segment extends to
the point 18 comma 15.
- Enter to expand or collapse answer. Answer expanded
- Correct Response: B. The height of the plant can be represented by the graph of a piecewise function. Let a equals height of a mature plant, b equals height of a trimmed plant, and c equals final height after new growth. The mature plant has a constant height, so until the student trims, the height can be described by the function y equals a. When it is trimmed, the plant's height decreases to height b, but cannot be any of the heights between a and b, so the graph is not connected there. The plant continues to grow at a constant (linear) rate until its height levels off again at height c, so this height can be described by the function y = c. Option B best describes the height of the plant.
Competency 0003
Geometry and Statistics
6. A cylindrical fish tank has a diameter of 24
cm
and a height of 60
cm.
If a certain small fish requires approximately
- 14
- 28
- 32
- 56
- Enter to expand or collapse answer. Answer expanded
- Correct Response: A. The volume of a cylinder is V equals pi r squared h, where r is the radius and h is the height. The height of the fish tank is 60 cm, so h equals 60, and given that the diameter of the fish tank is 24 cm, r equals 12. Therefore, V equals pi times 12 squared times 60 which is approximately equal to 27129.6 c m cubed Because these fish require 1925 c m cubed of water, divide the volume by this number and obtain approximately 14.10, or 14 fish.
7. start bold Use the table and student work below to answer the question that follows. end bold
Color Points Probability of Color Blue 100 0.05 Red 50 0.30 Yellow 0 0.65 Student Calculation: 100 times 0.05 plus 50 times 0.3 plus 0 times 0.65 equals 20
The table summarizes a certain game in which randomly selected colors are assigned point values and probabilities. A student uses the table to complete the calculation shown. The student's calculation most directly answers which question?
- By how much does the number of points vary?
- What is the expected value of the number of points?
- What is the probability that the outcome of any given play of the game will be a specific color?
- How many times must the game be played to ensure that at least one of each color appears?
- Enter to expand or collapse answer. Answer expanded
- Correct Response: B. The table shows possible colors and their resulting point values and probabilities in a game. That is, there is a 5 percent chance that blue will occur, which will result in 100 points; there is a 30 percent chance that red will occur, which will result in 50 points; and there is a 65 percent chance that yellow will occur, which will result in 0 points. The number of points that can be expected in the long run on any given play of the game can be calculated as: (number of points for a specific color) times (probability of the specific color) for each color. In this case, 100 times 0.05 for blue, 50 times 0.3 for red, and 0 times 0.65 for yellow. Summing these values, the student calculates the expected value of the number of points.