
Study Guide
Field 107: School Building Leader Part 1
Sample Performance Tasks
Recommendation for individuals using a screenreader: please set your punctuation settings to "most."
Sample Directions
For each of the assignments in this section, you are to prepare a written response and record it in the on-screen response box presented with each assignment. You should use your time to plan, write, review, and edit your response for each assignment. start bold You must write responses to all of the assignments in this section. end bold
Read each assignment carefully before you begin to work. Think about how you will organize each of your responses. You may use the erasable *notebooklet to make notes, write an outline, or otherwise prepare your response. start bold However, your final response to each assignment must be typed in the on-screen response box presented with the assignment end bold . Each assignment contains directions for the suggested length for an appropriate response. You may use the word-count feature in the lower left corner of the response box to monitor the length of your response.
Your response to the written assignment will be evaluated on the basis of the following criteria:
start bold COMPLETENESS: end bold The degree to which the response addresses all parts of the assignment
start bold ACCURACY: end bold The degree to which the response demonstrates the relevant knowledge and skills accurately and effectively
start bold DEPTH OF SUPPORT AND UNDERSTANDING: end bold The degree to which the response provides appropriate examples and details that demonstrate sound reasoning and reflects a strong understanding of the relevant knowledge and skills
Your responses will be evaluated on the criteria above, not on writing ability. However, your responses must be communicated clearly enough to permit valid judgment of your knowledge and skills. Your responses should conform to the conventions of edited American English. This should be your original work, written in your own words, and not copied or paraphrased from some other work.
Be sure to write about the assigned topics. You may not use any reference materials during the test. Remember to review your work and make any changes that you think will improve your responses. You may work on the assignments in any order you choose, but be sure to finish all three assignments before the end of the test session.
*notebooklet: A small, hand-held erasable whiteboard
Assignment 1: Instructional Leadership
start bold Use the information below and the six documents provided to complete the task that follows. end bold
You are the new school building leader of Branson Heights Middle School. The school is located on the outskirts of a relatively affluent suburb. Over the past three years, the school has maintained a steady enrollment of approximately 750 students in grades 6 to 8. Staffing has remained stable for the last two years. Approximately 25 percent of students at Branson Heights are eligible for free or reduced-price meals and the community has experienced a slight economic downturn with the closing of a few major employers. School faculty and staff strive to provide a positive environment for all students and families. Branson Heights enjoys strong community and family support.
The district's new superintendent has charged you with developing an instructional change plan for the middle school. Many of the district's professional development sessions have focused on reevaluating the mathematics curriculum to align it to the Common Core Learning Standards ( C C L S ), looking at formative assessment data to measure student growth, and conducting cross-curricular planning sessions to embed more complex text in all lessons. Branson Heights has redesigned its mathematics curriculum to reflect the C C L S and to align with the focus topics identified by the C C L S as the major work of each grade. Your teachers have been very active in supporting the curriculum redesign and have asked for professional development to support its implementation.
It is October and you have received the first round of formative assessment data.
Document 1
start bold Student Performance Indicators for Branson Heights Middle School end bold
start bold State Assessment Results for All Students
Two-Year Comparison end boldThis table displays the percentage of students in all groups scoring at or above Level 3 ("meets proficiency standard").
Subject School District State 2 Years Ago Last Year 2 Years Ago Last Year 2 Years Ago Last Year E L A 62 percent 67 percent 62 percent 60 percent 57 percent 58 percent Math 48 percent 49 percent 47 percent 50 percent 49 percent 50 percent start bold State Assessment Results, by Student Group
Two-Year Comparison end boldThis table displays the percentage of students, by group, scoring at or above Level 3 ("meets proficiency standard").
Percent of School Population 2 Years Ago Last Year E L A Math E L A Math Female 51 percent 67 percent 44 percent 72 percent 44 percent Male 49 percent 59 percent 52 percent 62 percent 54 percent Grade 6 31 percent 64 percent 53 percent 72 percent 54 percent Grade 7 33 percent 65 percent 50 percent 70 percent 51 percent Grade 8 36 percent 61 percent 45 percent 64 percent 46 percent Economically Disadvantaged 25 percent 50 percent 41 percent 53 percent 44 percent Limited English Proficient 19 percent 40 percent 36 percent 36 percent 37 percent Students with Disabilities 20 percent 41 percent 30 percent 44 percent 34 percent
Document 2
Formative Assessment Results, E L A and Mathematics
Formative Assesment Results for ELA Grade 6 through 8
(end of 1st quater)(percentage of students answering more than 65 percent
of formative assessment items correctly)This cell intentionally left blank. Grade 6 Grade 7 Grade 8 Reading Closely & Writing to Learn 51 percent 50 percent 47 percent Working with Evidence 50 percent 51 percent 47 percent Understanding through Research 48 percent 53 percent 55 percent Forming Positions 45 percent 48 percent 45 percent
Formative Assessment Results for Math Grade 6
(end of the 1st quarter)(percentage of students answering more than 65 percent
of formative assessment items correctly)Ratios and Proportional Relationships 63 percent The Number System 51 percent Expressions and Equations 44 percent
Formative Assesment Results for Math Grade 7
(end of 1st quarter)(percentage of students answering more than 65 percent
of formative assessment items correctly)Ratios and Proportional Relationships 55 percent The Number System 36 percent Expressions and Equations 34 percent
Formative Assesment Results for Math Grade 8
(end of 1st quater)(percentage of students answering more than 65 percent
of formative assessment items correctly)Expressions and Equations 29 percent Functions 37 percent Geometry 40 percent
Document 3
Student Survey Results for Branson Heights Middle School (last year)
E L A and Mathematics Classes, Grades 6, 7, 8
Student Survey Results
(average percent agreement)This cell intentionally left blank. Grade 6 E L A Classes Grade 7 E L A Classes Grade 8 E L A Classes Grade 6 Math Classes Grade 7 Math Classes Grade 8 Math Classes My teacher in this class cares about me as an individual. 92 percent 88 percent 80 percent 74 percent 69 percent 57 percent Students in this class stay busy and don't waste time. 86 percent 83 percent 90 percent 92 percent 88 percent 86 percent My teacher in this class explains difficult things clearly. 77 percent 75 percent 72 percent 47 percent 43 percent 38 percent My teacher in this class expects me to explain my answers and clarify why I think what I think. 52 percent 41 percent 35 percent 34 percent 36 percent 30 percent My teacher in this class makes learning enjoyable. 76 percent 64 percent 55 percent 38 percent 32 percent 27 percent My teacher in this class wants us to share our thoughts. 84 percent 82 percent 78 percent 28 percent 35 percent 22 percent My teacher in this class takes time to summarize what we have learned during each lesson. 42 percent 46 percent 50 percent 65 percent 62 percent 51 percent
Document 4
Excerpt from Teacher Survey Results (last year)
Branson Heights Middle School
Results of Anonymous Teacher Opinion SurveyWhen considering your experiences at Branson Heights Middle School over the past three years, how much do you agree that: E L A Teachers (percent agreeing or strongly agreeing) Math Teachers (percent agreeing or strongly agreeing) You enjoy working in this school. 83 percent 75 percent You feel effective in your role. 81 percent 73 percent All students are receiving instruction appropriate to their needs. 68 percent 53 percent You are interested in professional development opportunities to help you develop your ability to achieve instrumental goals for all of your students. 76 percent 84 percent You have access to ideas, support, and materials to effectively differentiate instruction for students of various ability levels. 72 percent 51 percent You possess the knowledge and skills needed to help students from all economic backgrounds and family circumstances progress academically at an adequate pace. 64 percent 47 percent You possess the knowledge and skills needed to help English Language Learners progress academically at an adequate pace. 58 percent 46 percent Diverse learners are welcomed and appreciated at this school. 89 percent 86 percent English Language Learners are generally receiving effective instruction. 61 percent 52 percent The school provides appropriate enrichment opportunities for higher-achieving students. 72 percent 78 percent
Document 5
Teacher Evaluation Data
Composite Evaluation Scores: All Teachers (last year)(as assessed through multiple measures, including a state-provided growth score or other comparable measure and locally selected measure of student achievement and other measures of teacher effectiveness)
Ineffective Developing Effective Highly Effective Subject Area Total Teachers N percent N percent N percent N percent Grade 6 E L A 6 0 0.0percent 0 0.0percent 4 66.7percent 2 33.3percent Grade 6 Math 6 0 0.0percent 1 16.7percent 5 83.3percent 0 0.0percent Grade 6 Special Education 4 0 0.0percent 1 25.0percent 2 50.0percent 1 25.0percent Grade 6 Non-Core (G&T, Library Media, Health) 3 0 0.0percent 0 0.0percent 2 66.7percent 1 33.3percent Grade 7 E L A 6 0 0.0percent 1 16.7percent 3 50.0percent 2 33.3percent Grade 7 Math 6 0 0.0percent 2 33.3percent 3 50.0percent 1 16.7percent Grade 7 Special Education 3 1 33.3percent 0 0.0percent 2 66.7percent 0 0.0percent Grade 7 Science, Social Studies, Foreign Language 9 0 0.0percent 1 11.1percent 6 66.7percent 2 22.2percent Grade 8 E L A 6 0 0.0percent 0 0.0percent 4 66.7percent 2 33.3percent Grade 8 Math 6 0 0.0percent 2 33.3percent 3 50.0percent 1 16.7percent Grade 8 Special Education 2 0 0.0percent 0 0.0percent 2 100percent 0 0.0percent Grade 8 Science, Social Studies, Foreign Language 10 0 0.0percent 0 0.0percent 5 50.0percent 5 50.0percent Grade 6-8 Specialty Areas (PE, Art, Music, FACS) 10 1 10.0percent 1 10.0percent 4 40.0percent 4 40.0percent Key:
G and T – Gifted and Talented
P E – Physical Education
F A C S – Family and Consumer Science
Document 6
Teacher Observation Summary Data (last year)
(number of teachers scoring at each level of performance on the teacher practice rubric)
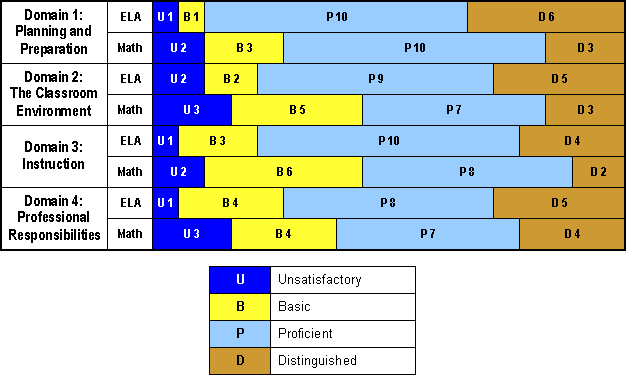
Domain 1: Planning and Preparation Domain 2: The Classroom Enviroment Domain 3: Instruction Domain 4: Professional Responsibilities E L A Math E L A Math E L A Math E L A Math Unsatisfactory 1 2 2 3 1 2 1 3 Basic 1 3 2 5 3 6 4 4 Proficient 10 10 9 7 10 8 8 7 Distinguished 6 3 5 3 4 2 5 4 Chart showing the teacher Observation summary data from last year with the number of teachers scoring at each level of performance on the teacher practice rubric in domain one planning and preparation in e l a there was one unsatisfactory one basic ten proficient and six distinguished in math there were two unsatisfactory three basic ten proficient and three distinguished in domain two the classroom environment in e l a there were two unsatisfactory two basic nine procient and five distinguished in math there were three unsatisfactory five basic seven proficient and three distinguished in domain three instruction in e l a there was on unsatisfactory three basic ten proficient and four distinguished in math there were two unsatisfactory six basic eight proficient and two distinguished in domain four professional responsibilities in e l a there was one unsatisfactory four basic eight proficient and five distinguished in math there were three unsatisfactory four basic seven proficient and four distinguished
Read the six documents provided. Based on the information provided, respond to each of the following prompts. Be very specific in your answers, citing evidence from the scenario and documents as appropriate.
- Identify one strength of this school, citing evidence to support your response.
- Identify three areas of need in the instructional program, citing evidence to support each need.
- Which area of need would be your highest priority? Explain why.
- What are two important questions you must answer to address your highest priority area of need? Explain why each question is important to address.
- How will you go about getting answers to EACH question?
- What actions would you take to address the school's priority need? Explain why.
- How would you leverage the identified strength of the school (see Part A) to address the priority need?
- What possible challenges might your actions create and what are some ways that you could manage these challenges?
Your response should be approximately 600 to 800 words and may be in a format of your choice (e.g., paragraphs, bulleted list).
Sample Response to Assignment 1
(710 words)
A. A major strength at Branson Heights Middle School is the staff?s support of students and dedication to improvement. Teachers have supported the curriculum redesign and over 75 percent of all math and E L A teachers would like professional development to improve their practice. Moreover, staff are aware of areas where improvement is needed such as their ability to meet the needs of E L Ls.
B. 1. Student performance in mathematics is stagnant, with just under 50 percent of students meeting proficiency on statewide assessments and minimal growth for each grade level and student subgroup. Formative assessment results suggest limited understanding of C C L S -aligned math concepts. 47 percent of math faculty report lacking the knowledge and skills to teach all students. Student survey results suggest low teacher expectations, minimal explanation, and failure to engage students in higher-level thinking.
2. Students who are limited English proficient ( L E P ) and students with disabilities ( S W Dees ) score substantially below the general population and below students who are economically disadvantaged on statewide assessments. While S W Dees showed some improvement over the past two years, the performance of students who are L E P declined in E L A , to 36 percent meeting proficiency, and remained flat in math.
3. Discrepancies exist between teacher evaluation and teacher observation summary data. A majority of teachers were rated "effective" or "highly effective" last year. Teacher observations indicate weaknesses, however. For example, 8 of 18 math teachers were rated "basic" or "unsatisfactory" in the classroom environment and instruction domains.
C. The highest priority is low achievement for students who are L E P and S W Dees. 19 percent of students are identified as L E P and 20 percent as S W Dees, well above the state average. Less than 45 percent of these populations are meeting proficiency standards in E L A and Math. A substantial portion of the student population thus does not receive adequate instruction. Support for these subgroups is needed to increase their access to the curriculum, improving equity and overall school performance.
D. 1. What professional development opportunities and instructional resources would be most effective in helping teachers reach students who are L E P and S W Dees? This information is essential to ensure teachers gain the knowledge and skills to meet the needs of all students. For example, only 58 percent of E L A and 46 percent of math teachers feel they possess the knowledge and skills to meet the needs of E L Ls, indicating many cannot provide effective instruction for students who are L E P. Generalized professional development will not be sufficient.
2. What steps can be taken to align teachers' self-perceptions with evidence indicating weaknesses in instructional practices and skills? A majority of teachers feel they are effective, despite evidence that students who are L E P and S W Dees are not receiving adequate instruction. Teachers who recognize the need for improvement are more likely to adopt new practices and skills.
E. The first step is conducting a needs assessment to determine what professional development is required for faculty to meet the needs of students who are L E P and S W Dees. In addition, teachers should engage in reflection and cycles of inquiry to recognize discrepancies between their perceptions and evidence of instructional weaknesses. The principal's role will be to facilitate data analysis and the development and implementation of action plans.
F. 1. Utilize grade level and/or departmental teams to review student performance data, examine student work, assess instructional practices, and commit to improvement in instruction for students who are L E P and S W Dees. Staff must own the performance of students in these subgroups and understand each teacher's role in improving their achievement.
2. Implement job-embedded professional development activities related to improving instruction for these subgroups. Teachers should spend the majority of their team planning and meeting time focusing on student learning and instructional improvement.
G. Branson Heights's positive learning environment can be leveraged to address this need. In particular, strong interest in professional development opportunities to achieve instructional goals for all students ( 76 percent of E L A and 84percent of math teachers) could encourage staff to commit to instructional improvement.
H. 1. Tension from teachers with inflated self-perception of instructional effectiveness when confronted with contradictory data.
2. Communicating the need to improve instruction and achievement for students who are L E P and S W Dees as part of an overall school improvement plan.
Managing these challenges will require full staff involvement. Working with teacher leaders and implementing effective data analysis throughout the school will be important. The goal is to instill a heightened sense of commitment to improvement for all students.
Analysis of Response
The response demonstrates strength in the following Performance Characteristics.
start bold Completeness: The degree to which the response addresses all parts of the assignment end bold
The response thoroughly and completely addresses all aspects of each prompt, including actions to be taken, rationales for these choices, and evidence from the documents. The evidence cited is sufficient in quantity and quality and reflects an accurate interpretation of the data. The response illustrates the inquiry stance of a strong instructional leader. Taken as a whole, the multiple sections of the response draw upon all sources of data provided in the documents.
start bold Accuracy: The degree to which the response demonstrates the relevant knowledge and skills accurately and effectively end bold
The response reflects an accurate interpretation of the data provided, as well as the content of the scenario. Student and teacher survey information are cited to support the identified school strength, and the issue identified as the highest priority—low achievement for students who are L E P and S W Dees —is clearly essential in promoting achievement for all students. Assessment data are used accurately to identify concerns and establish appropriate priorities related to instruction. Information drawn from the teacher survey data is used to identify steps which are likely to ensure that all students, including students who are L E P and S W Dees, have full and equitable access to educational programs and curricula. The response further demonstrates an understanding of the need for specific, targeted professional development in response to individual teacher needs, as well as the actions the school building leader should take to support and monitor plans for teacher growth and provide effective feedback.
start bold Depth of Support and Understanding: The degree to which the response provides appropriate examples and details that demonstrate sound reasoning and reflects a strong understanding of the relevant knowledge and skills end bold
The response illustrates the depth of understanding needed by a school building leader to act as an effective instructional leader and to establish the culture and foundational structures that would enhance the professional growth of the staff. Rationales provided for decisions about immediate priorities and areas for further inquiry demonstrate a balanced use of objective and subjective data to guide leadership actions. By raising questions that distinguish between the availability of instructional resources and teacher perceptions of their status and needs, the response illustrates a problem-solving approach that effectively utilizes both materials and staff motivation. In addition, the analysis of challenges is logical and significant, and conveys a school building leader?s respect for staff, willingness to engage teacher leaders in distributed leadership, and awareness of potential biases. Overall, the response demonstrates understanding of the scenario, appropriate use of data, and sound, logical reasoning.
Assignment 2: Educational Equity
start bold Use the information below to complete the task that follows. end bold
You are the new school building leader of an urban middle school with an enrollment of approximately 1,200 students in grades 6 to 8. The school has a gifted and talented program in which eligible students are pulled out for enrichment classes in English Language Arts and mathematics once a week. Most of the students in the program participated in a gifted and talented program at one of several district elementary schools.
Before the school year begins, a group of parents and guardians comes to see you with concerns about the gifted and talented program's admission criteria. In your first meeting with staff, you met with various faculty members and teams within the building, including Ms. S, the gifted and talented teacher. You learned that Ms. S has overseen the gifted and talented program for the past five years. During that time, the program has grown from 50 participants to approximately 125 participants. Ms. S told you that students are selected for the program based on a combination of scores on diagnostic screening assessments and teacher nominations.
During the first few weeks of school, you walked through the school building throughout the day visiting classrooms and getting to know students, faculty, and staff. You noticed that the school as a whole reflects substantial economic, cultural, and language diversity; however, in your visits to the gifted enrichment classes, you realized that very few students who participate in the gifted and talented program reflect this diversity. After checking available information on students who currently participate in the gifted and talented program, you created the table below.
You visited a number of general education classrooms and noted several students who appeared to have advanced knowledge and understanding, with outstanding verbal abilities. They made particularly articulate responses that reflected deep understanding of the topics at hand, and their questioning of the teacher exceeded typical classroom exchanges. It is apparent in your observations that these students would benefit from more challenging instruction. You learned from Ms. S that some of these students are not eligible for the program, due to low scores on the screening assessments used for selection.
Students in the Gifted and Talented Program, Current Year Student Subgroup Percentage of the Student Body Percentage of All Students in the Gifted and Talented Program Limited English Proficient 27 percent 4 percent Economically Disadvantaged 52 percent 15 percent Students with Disabilities 11 percent 1 percent
Based on the information provided, respond to each of the following prompts. Be very specific in your answers, citing evidence from the scenario as appropriate.
- What is the primary issue presented in this scenario, and why do you believe this to be so?
- What are two important questions you must address in order to explore this issue? Explain why each is important to address.
- How will you go about getting answers to start uppercase EACH end uppercase question? What challenges might you face in getting answers to your questions?
- Describe one possible finding of your inquiry process and the potential action that finding would imply.
Your response should be approximately 300 to 400 words and may be in a format of your choice (e.g., paragraphs, bulleted list).
Sample Response to Assignment 2
(388 words)
The primary issue is the underrepresentation of diverse students in the gifted and talented program. The program does not reflect the school's diversity despite recent expansion. Parental/guardian concerns about the program's admission criteria, demographic data regarding the program, meetings with faculty, and classroom observations all demonstrate the seriousness of this issue.
One question I will address is: To what extent does the selection process for the program provide access to all students? This question focuses attention on the process for teacher nominations, the diagnostic assessment, as well as the program's design. These elements could inadvertently create a narrow focus or bias in selection. A second important question is: Are teachers setting rigorous academic expectations for all students? Evidence from classroom visits suggests that there are a number of students in the school whose verbal abilities and advanced knowledge and understanding of content might make them excellent candidates for the program.
To answer the first question, I would conduct a thorough review of the selection process in light of current research and best practice. I would speak with referring teachers to determine their selection criteria. In addition, I would also consider whether the program structure or schedule impacts which students are nominated. Further, observations will be required to answer the second question. I would share evidence from observations with faculty and hold discussions focused on high expectations for all as well as access to the gifted and talented program. It would be appropriate to share all findings with Ms. S and involve her in actions to expand access and increase equity. Challenges may arise as I review the program. I may find that the timing or the criteria for the nomination process are problematic. I may also find that some teachers do not believe all student subgroups are capable of succeeding in the program due to the rigorous expectations.
One possible finding is that the current selection process for the gifted and talented program is restricting access. If so, I would need to follow any procedures established by my district to address my concerns regarding the need to increase diversity in the program. My conversations may include but would not be limited to the diagnostic exam, the admissions process, professional development aimed at helping teachers recognize students who would benefit from the program, and increased administrator oversight and support.
Analysis of Response
The response demonstrates strength in the following Performance Characteristics.
start bold Completeness: The degree to which the response addresses all parts of the assignment end bold
The response fully addresses all components of each question. A primary issue, two questions to be addressed, steps to answer each question, possible challenges, potential findings, and actions necessitated by those findings are identified and explained. In addition, the response is supported by a thorough and accurate interpretation of the scenario and the data provided.
start bold Accuracy: The degree to which the response demonstrates the relevant knowledge and skills accurately and effectively end bold
The response identifies a primary issue that is rooted in an accurate evaluation of the concerns presented in the scenario and table. The failure of the gifted and talented program to reflect the school?s diverse population, parent/guardian concerns about admission criteria, and observations of student performance are all considered. The response identifies appropriate questions regarding the accessibility of the selection process and whether or not teachers are setting rigorous expectations for all. The importance of these questions is accurately explained, and appropriate, effective procedures for answering them are outlined. The challenges and possible findings identified are accurate, logical, and probable given the scenario and data. The action in response to possible findings is clearly described and likely to be effective.
start bold Depth of Support and Understanding: The degree to which the response provides appropriate examples and details that demonstrate sound reasoning and reflects a strong understanding of the relevant knowledge and skills end bold
The response demonstrates a thorough understanding of the role of the school building leader in the given situation. A clear emphasis is placed on working with others in the school community to promote excellence and equity. Accurate and thorough interpretation and synthesis of relevant information in the scenario and data are evident throughout the response, as is a firm commitment to academic excellence, creating an equitable learning environment, and ensuring all students are considered for educational programs of this nature. Clear and relevant examples and details are given throughout.
Assignment 3: School Culture and Learning Environment
start bold Use the information below to complete the task that follows. end bold
You are the new school building leader in a rural school with an enrollment of approximately 500 students in grades K to 12 . The school has experienced very little staff turnover over the past five years and, on average, the teachers have 58 years of teaching experience. Your review of student performance on the state and formative assessments shows that student performance in mathematics and English Language Arts has remained flat for the past two years.
A few months into the school year, you noticed that there seems to be a relatively large number of referrals for minor student discipline problems in grades 3 to 5 , such as excessive talking, inappropriate language, roughhousing, and uncooperative behavior. A summary of the referral data is shown below. The school has a code of conduct in place that outlines behavior guidelines and consequences for inappropriate behavior. In the past, teachers have used these guidelines to develop their own classroom rules and expectations.
For the next teacher professional development day, you asked members of your leadership team to plan a series of conversations about classroom management based on the teacher practice rubric the district adopted for evaluation purposes. After allowing teachers time to reflect on the conversations and their own practice, you decided to make a brief visit to each third-, fourth-, and fifth-grade classroom to observe student behavior and interactions and gain insight into teachers' approaches to maximizing opportunities for learning in the classroom. During these visits, you observe that most teachers seem to have caring relationships with their students. However, some of the teachers interacted with students in an almost overly casual manner.
During the classroom visits, you also had an opportunity to see some of the classroom discipline issues. Some teachers ignored behavioral problems and moved on with instruction. In a couple of the classes, a significant portion of the students in the class were either off task or so distracted by their off-task peers that they were not effectively participating in the instruction. Other teachers stopped instruction and administered immediate consequences for each misbehavior, consuming significant class time. In general, teachers exhibited a range of responses to problem behaviors within and across classes.
Discipline Referrals by Teacher for Quarters 1 and 2, Grades 3, 4, 5
(current year)Excessive Talking Inappropriate Language Uncooperative Roughhousing Disrespectful Disruptive TOTAL Teacher A (grade 3) 0 1 0 2 0 2 5 Teacher B (grade 3) 5 0 2 5 3 2 17 Teacher C (grade 4) 8 2 8 3 4 7 32 Teacher D (grade 4) 0 1 3 0 2 5 11 Teacher E (grade 5) 0 2 7 1 0 1 11 Teacher F (grade 5) 13 2 8 5 5 11 44 TOTAL 26 8 28 16 14 28 120
Based on the information provided, respond to each of the following prompts. Be very specific in your answers, citing evidence from the scenario as appropriate.
- What is an important school culture and learning environment issue presented in this scenario? Explain why the issue you chose is important.
- What are two important questions you must address in order to explore this issue? Explain why each is important to address.
- How will you go about getting answers to start uppercase EACH end uppercase question? What challenges might you face in getting answers to your questions?
- Describe one possible finding of your inquiry process and the potential action that finding would imply.
Your response should be approximately 300 to 400 words and may be in a format of your choice (e.g., paragraphs, bulleted list).
Sample Response to Assignment 3
(388 words)
A. Classroom discipline issues are leading to decreased instructional time. There have been approximately 120 discipline referrals in grades 3 to 5 during the current school year for minor problems. Students who are not in class are not engaged in learning. In addition, evidence from classroom visits suggests discipline problems continue despite the high rate of referral, resulting in students being disengaged or distracted.
B. Two questions that must be addressed are: 1) Are teachers using the code of conduct to create classroom rules and expectations that are taught to students? and 2) To what extent are teachers consistently applying rules and expectation in their classrooms? The first question is important because classroom visits and discipline referral data suggest that individual teachers are setting very different rules and expectations. Also, it is not clear that all teachers are teaching the rules and expectations they set to students. The second question is important because it appears from classroom visits that some teachers are not consistently applying rules and expectations. It is necessary to determine whether teachers are deviating from or ignoring school discipline policy.
C. To find answers to these questions:
- Survey teachers regarding how they align classroom rules and expectations with the code of conduct and how they are teaching rules and expectations to students, as well as their professional development needs.
- Conduct formal classroom observations in grade 3 to 5 classrooms, using an appropriate rubric to document student behavior and evaluate teacher responses. Evidence from the observations would provide a basis for feedback to teachers regarding classroom management.
Challenges may include teachers' resistance to what they might perceive as an intrusion into their classroom management. In addition, staff perceptions of student discipline and their own implementation of the code of conduct may not be accurate.
D. A possible finding is that several teachers face significant challenges in classroom management. Such a finding would require prompt action. For example, referral data indicate Teachers C and F need immediate assistance and support for improving behavior in their classrooms. Classroom visits further suggest other teachers ignore behavior problems that become distractions for all students. These teachers need targeted support to improve classroom management, such as coaching, additional professional development activities, and regular observations and evidence-based feedback from the school building leader. After taking these steps, the building leader can hold staff accountable for maintaining appropriate behavior standards.
Analysis of Response
The response demonstrates strength in the following Performance Characteristics.
start bold Completeness: The degree to which the response addresses all parts of the assignment end bold
The response fully addresses all components of each prompt within the assignment. A primary issue, two important questions to be addressed, procedures for answering each question, potential challenges, a potential finding, and a planned response to that potential finding are all presented and sufficiently developed. Evidence from the scenario and data table are cited appropriately throughout the response.
start bold Accuracy: The degree to which the response demonstrates the relevant knowledge and skills accurately and effectively end bold
The response identifies a primary issue, discipline issues leading to decreased instructional time, that is justified by evidence presented in the scenario and table. The importance of this issue is accurately explained. The response identifies two crucial questions to address regarding implementation of the code of conduct and discipline issues in other grade bands. Appropriate and effective procedures for answering each question are outlined, with consideration given to the possible need for professional development and the use of rubrics in classroom observations. Challenges and possible finding are significant and highly probable. The proposed action responding to that finding is both appropriate and effective.
start bold Depth of Support and Understanding: The degree to which the response provides appropriate examples and details that demonstrate sound reasoning and reflects a strong understanding of the relevant knowledge and skills end bold
The response demonstrates a thorough understanding of the role of the school building leader with regard to establishing and maintaining a school culture focused on academic excellence. Careful analysis and evaluation of evidence presented in the scenario and table is evident throughout the response, as well as an understanding of how various factors such as student behavior and teacher perceptions affect the culture of the school. Clear and relevant examples and details are used throughout the response to support analyses and proposed actions.
Performance Characteristics for Assignments 1 to 3
The following characteristics guide the scoring of responses to each assignment.
| COMPLETENESS | The degree to which the response addresses all parts of the assignment |
|---|---|
| ACCURACY | The degree to which the response demonstrates the relevant knowledge and skills accurately and effectively |
| DEPTH OF SUPPORT AND UNDERSTANDING | The degree to which the response provides appropriate examples and details that demonstrate sound reasoning and reflects a strong understanding of the relevant knowledge and skills |
Score Scale for Assignments 1 to 3
Scores will be assigned to each response to the assignments according to the following score scale.
| Score Point | Score Point Description |
|---|---|
| 4 | The "4" response reflects a thorough command of the relevant knowledge and skills. |
| 3 | The "3" response reflects a general command of the relevant knowledge and skills. |
| 2 | The "2" response reflects a limited command of the relevant knowledge and skills. |
| 1 | The "1" response reflects little or no command of the relevant knowledge and skills. |
| U | The response is unscorable because it is unrelated to the assigned topic or off-task, unreadable, written in a language other than English or contains an insufficient amount of original work to score. |
| B | No response. |